POP has been surveying all of our orchard partners at season’s end since 2013. Each year’s qualitative and quantitative results have shown growth, improvement, and areas in need of more attention. We want to share some of what we’ve learned with you!
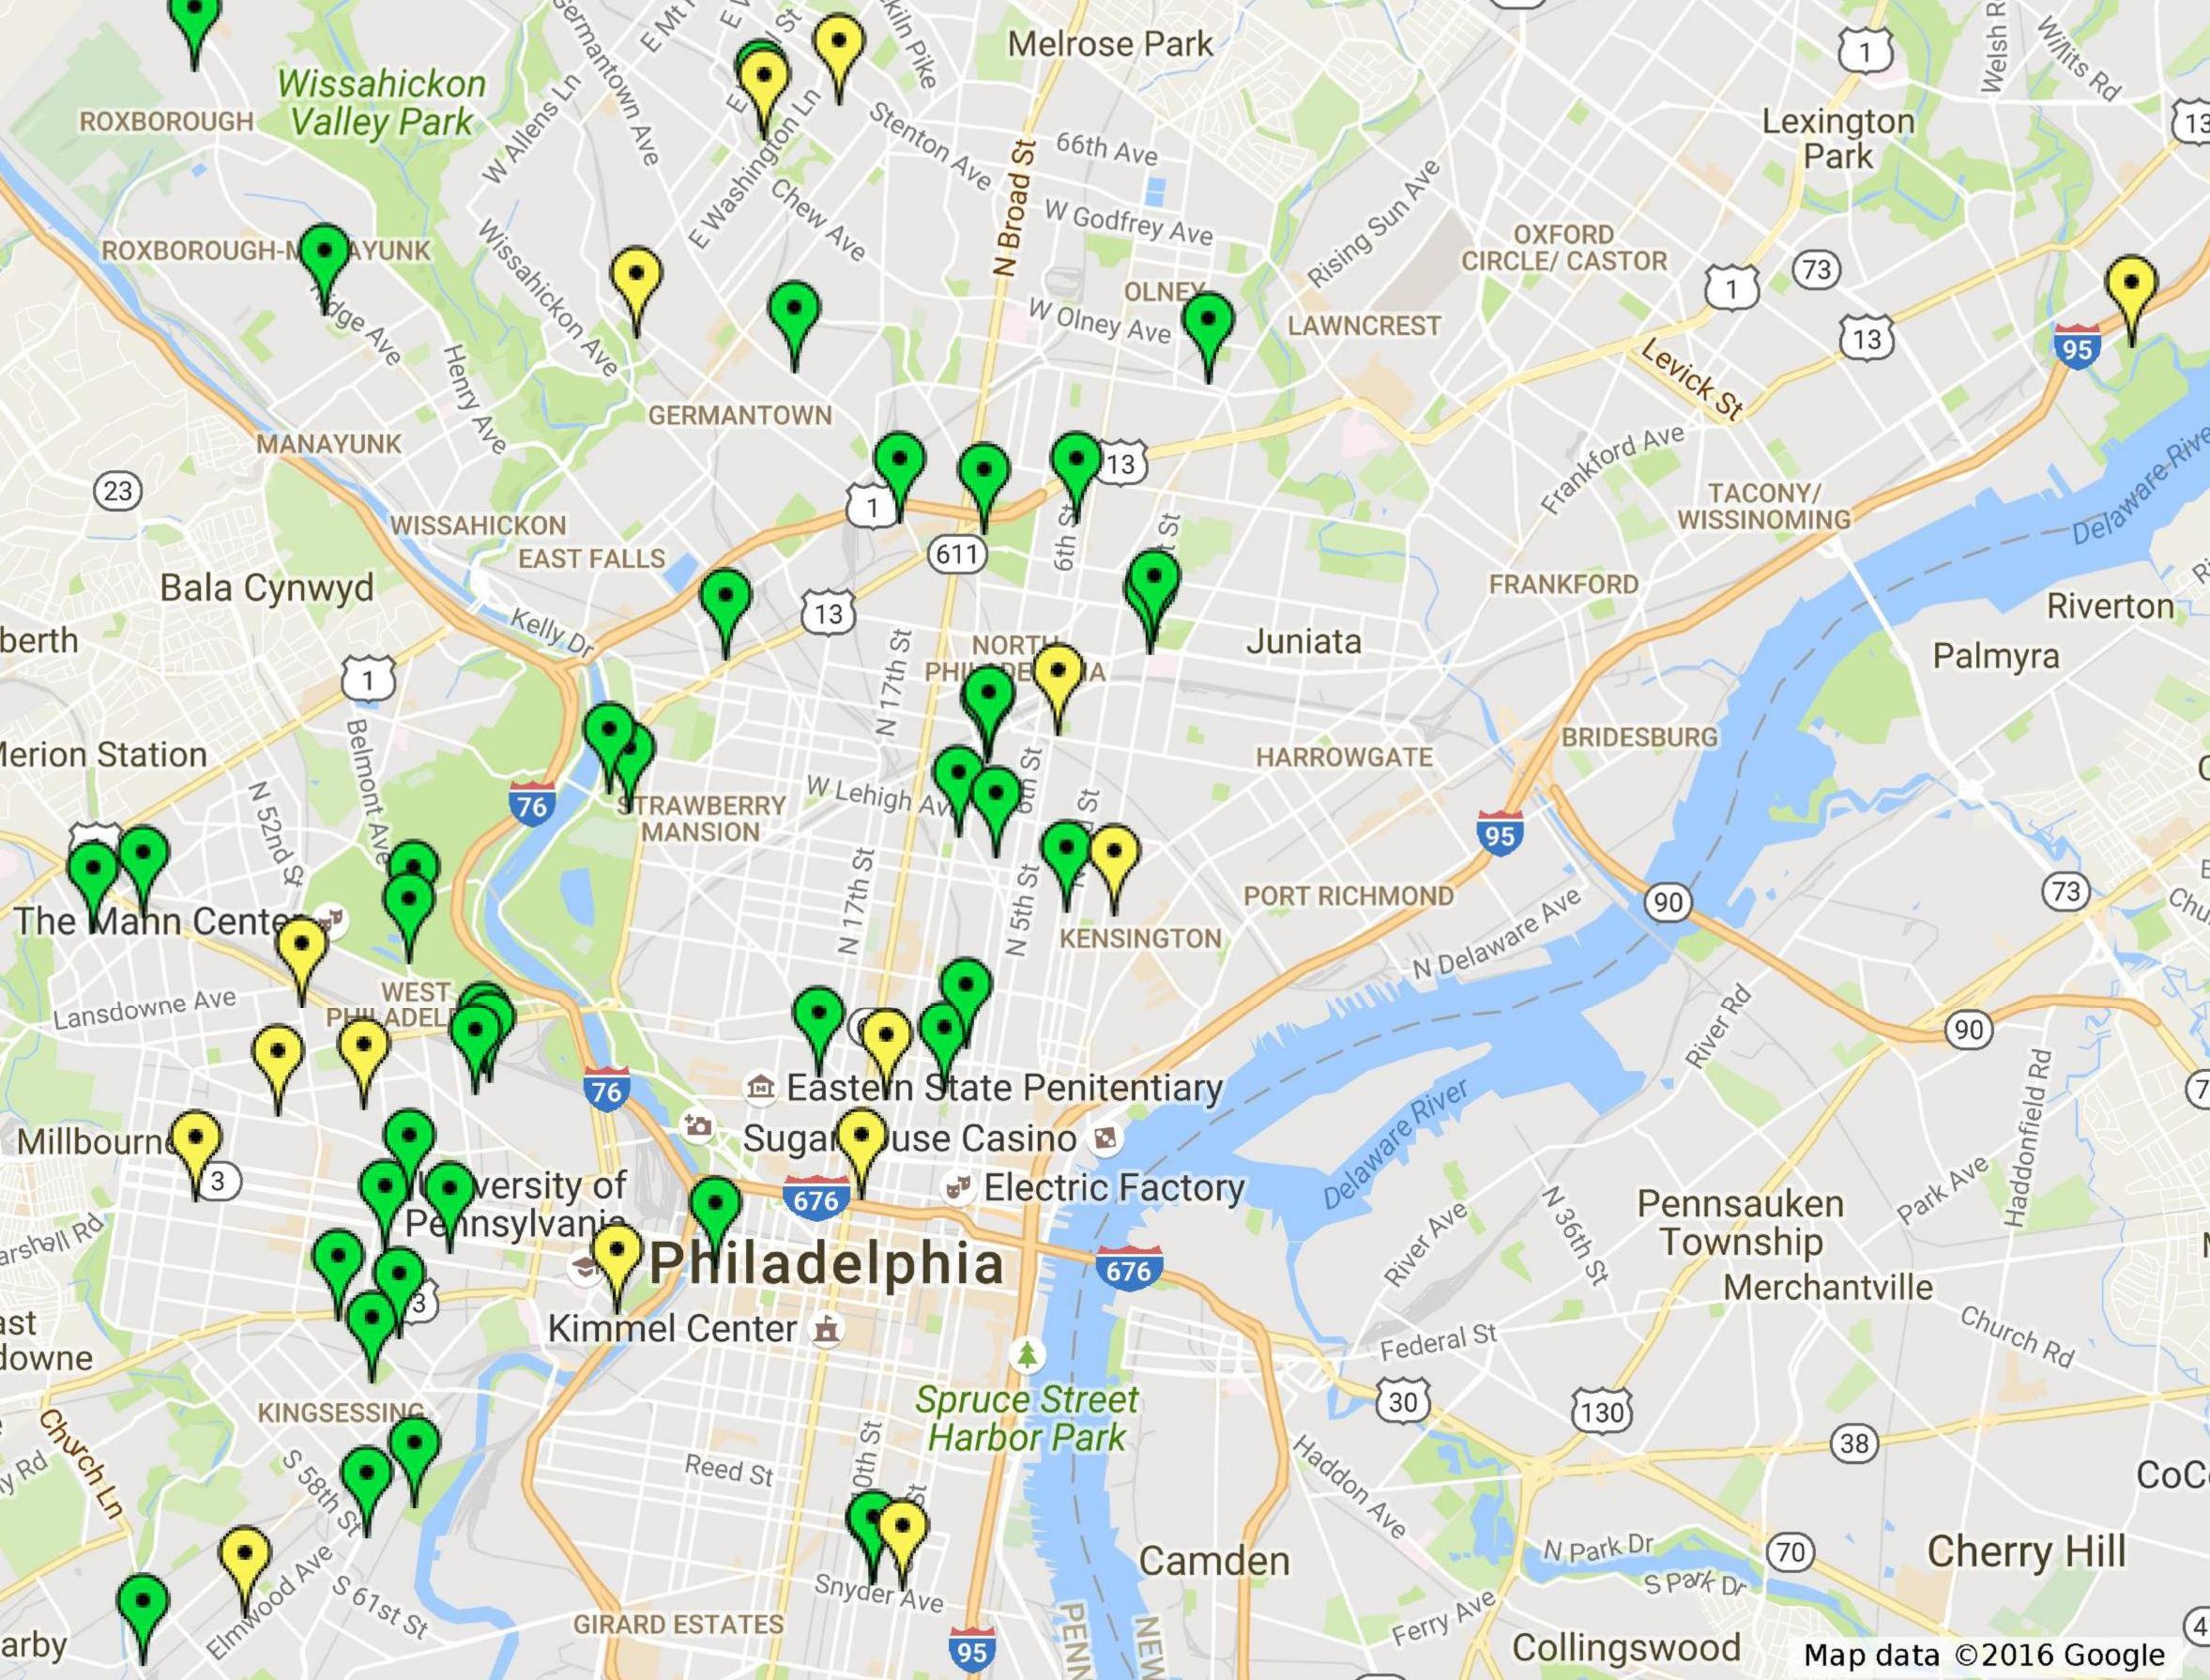
In all, 46 of 56 total POP partners (82%) participated in our 2016 survey. As a thank you, POP is distributing a requested orchard item, such as pruning tools, pole harvesters, produce scales, neem oil, or a desired plant, to all participating partners.
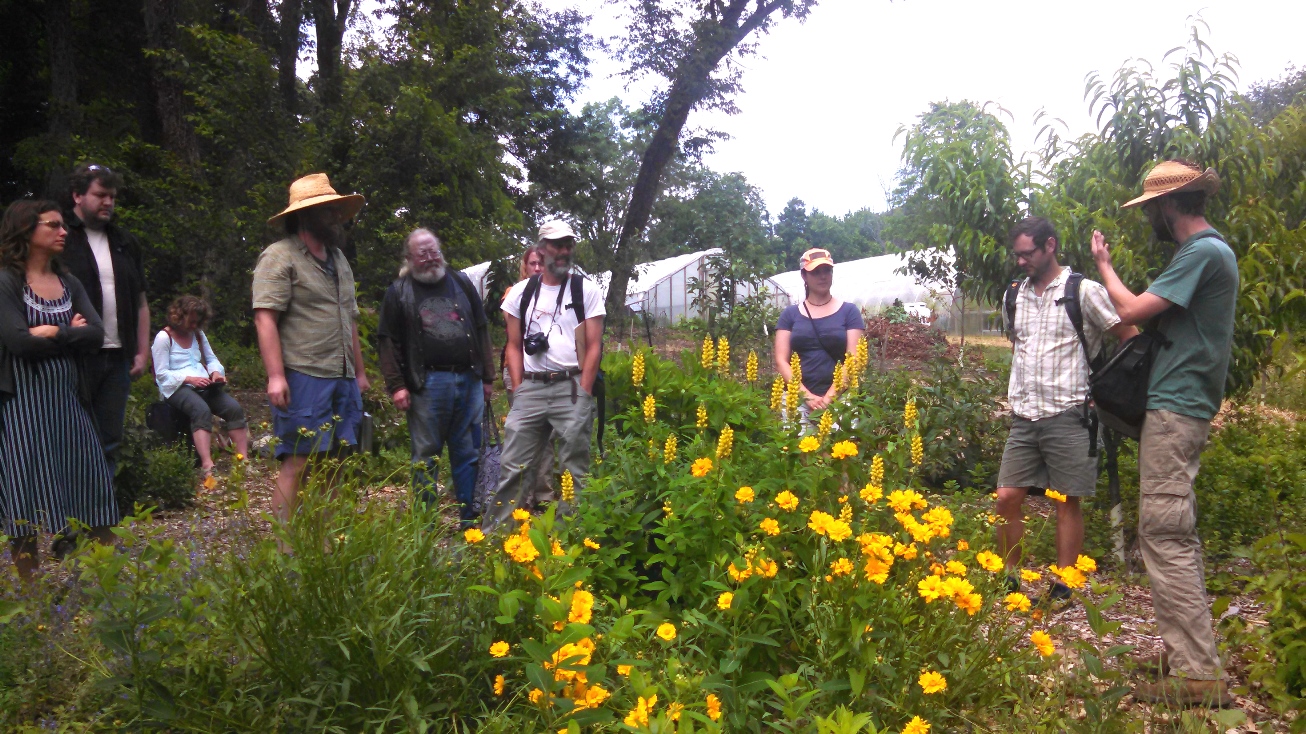
Orchard Value
This section is intended to help us understand what our partners value most about their orchards. The highest percentage of respondents rated “Educational Opportunities” in orchards as having the “highest value” (57%) for the fourth year in a row. Partners also most frequently placed Highest Value and High Value on orchard contributions to “Beauty and Neighborhood Greening” and “Environmental Impact.” A relatively lower rating for the value of food production and distribution is somewhat distorted by responses from younger and newly planted orchards that have not yet come into full production (a process that can take 5 years). However, many of our partner sites with more established plantings or larger numbers of plants rated food production and distribution with highest value.
To exemplify the varied things that can come from an orchard space: “POP’s initial planting day at Penn Alexander School was also the catalyst for a partnership between Girl Scouts of Eastern Pennsylvania, the Philadelphia Streets Department, and University City District. Additionally, Penn Alexander School Garden and Orchard won the ‘Garden of Distinction Award’ in the 2016 Pennsylvania Horticulture Society Gardening Contest–selected from among 300 entries!” Other specific uses of orchard spaces mentioned involve being refuges and resources for wildlife, sources of still life for art students, spaces of honor and memorial for loved ones, spaces for therapy, and spaces for safe play and exploration for children.

The survey’s request for stories illustrating the value of the orchard always provide some heartening responses that help provide qualitative support for the impact of POP’s work. The most common theme of these responses is the value of educating and exposing people to freshly grown fruit, the reactions that people have to tasting things for the first time, the lessons involved in learning to care for their orchard spaces, and the ways in which children respond to the spaces. More than half of all respondents also took time to write into at least one of their answers how thankful they are for the work that POP staff do for partners and their communities. Some of the most exciting partner testimonials from the 2016 season are contained in a separate blog post here.
Community Involvement
This set of questions was intended to assess the number of people involved with and affected by our orchards. Surveys reported:
- A total of 324 people throughout the city participate at least monthly in orchard care. This number is up 30% from last year’s survey.
- 2,200 people participated at least once in orchard care. This number is up 22% from last year.
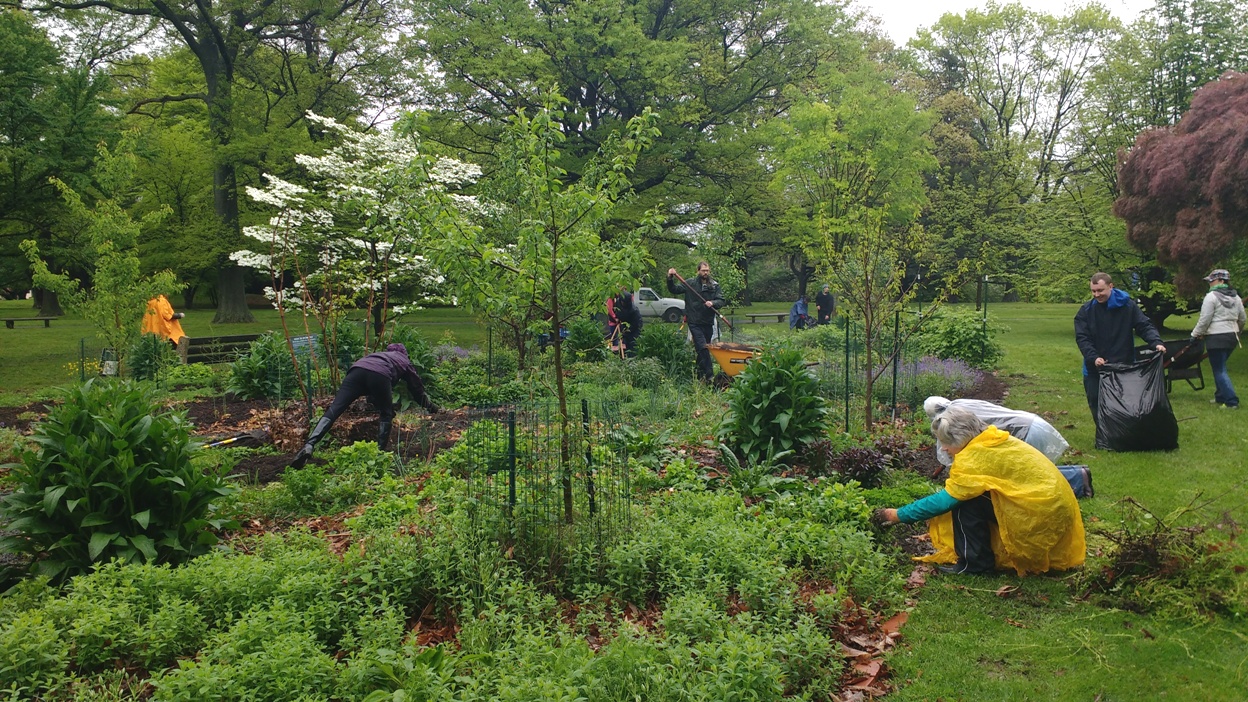
- 60% of respondents tend to their orchards at least every other week, and half of respondents have organized workdays at least once per month, doubling last year’s response!
- 4,609 people tasted something grown in a partner orchard.
- 4,300 people used a POP partner orchard as a gathering space.
- 4,800 people participated in educational programs at orchards. This number is up 38% from 2015!
Significant increases in regular attention, participation in regularly scheduled workdays, and the number of people participating in educational programming is fantastic news! These improvements in just one season are very encouraging indicators that our increasing number of orchard spaces and maturing orchards are reaching more people.
Distribution
This section was intended to assess where the produce from POP orchards is being distributed. Of total produce yielded by community orchards in 2016,
- 44% was harvested for free by community members (up 15% from 2015)
- 21% was distributed for free to community members (down 4% from 2015)
- 11% was lost to pest or diseases (up 3% from 2015)
- 6% was processed into value-added products (up 3% from 2015)
- 5% was sold at on-site farm stands! (down 3% from 2015)
- 5% was sold off-site at farmers’ markets (down 4% from 2015)
- 5% of ripe fruit went unharvested (down 3% from 2015)
- 2% was donated to emergency food pantries, and (not tracked in 2015)
- 1% was sold via Community Supported Agriculture (CSA) shares (down 2% from 2015)
The most significant and promising change shown is the 15% increase in produce being harvested by community members for their own use. This demonstrates increased involvement, agency, empowerment, education, and orchards continuing to be woven into the fabric of the neighborhoods in which they’re housed.
Orchard Production
This section was intended to evaluate what plants are yielding the best, gather data on actual production levels where available, and discover the production problems with which our partners need the most assistance. Compared to last year, 57% of applicable respondents reported an increase in orchard yield.
One of the challenges POP would like to address in coming years is expanding partners’ understandings of what is considered a “yield.” As orchard ecosystems mature, making use of understory plants in abundance will contribute to better overall maintenance and orchard value. Making more increased use of plants for medicine-making, fiber production, culinary spicing, and preserves are ways of expanding yields.
The total reported orchard production for 2016 is 5,000 pounds. This is a 28% increase, up from 3,910 pounds reported in 2015. The 3,910 pounds reported in 2015 was a 67% increase from 2014.
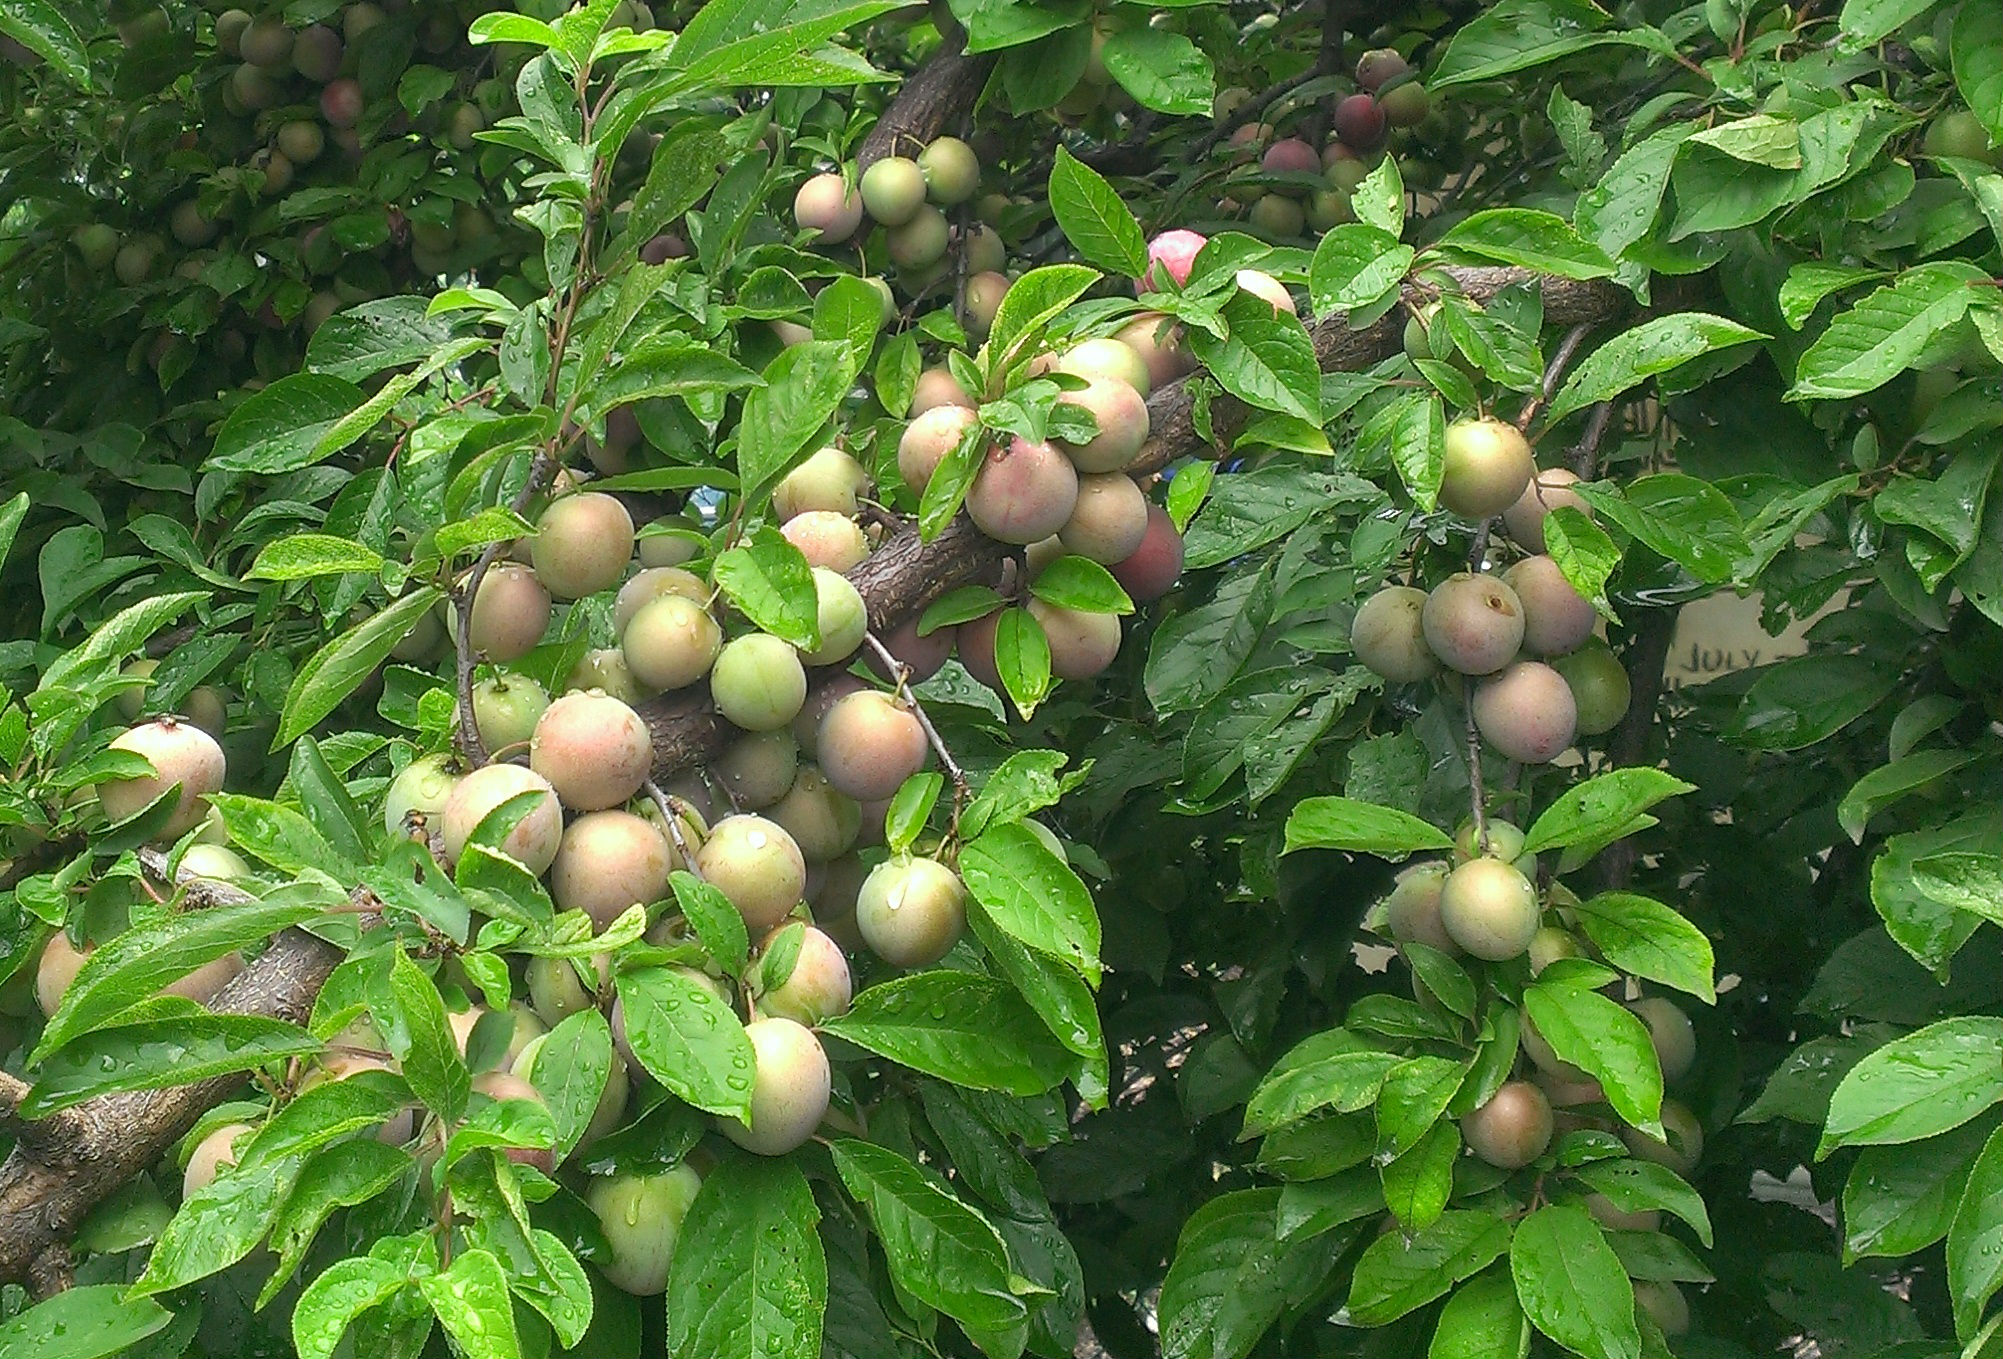
Based on survey analysis of tree fruits, peaches/nectarines, juneberries, plums, sweet cherries, apples, figs, and persimmons produced the highest yields, with juneberries, plums, sweet cherries, figs, persimmons, mulberries, and paw paws seeing the most significant increases in yields since 2015.
Several berry and perennial vegetable yields saw a decrease in reported yield from 2015, with a notable exception of raspberries and blackberry harvests greatly increasing. Overall, raspberries, strawberries, blackberries, and asparagus continue to yield the best. The best producers have quickly spreading growth habits and few pest pressures, and the lowest producers are lesser-known, lesser-harvested, and lesser-planted shrubs in our orchards overall.
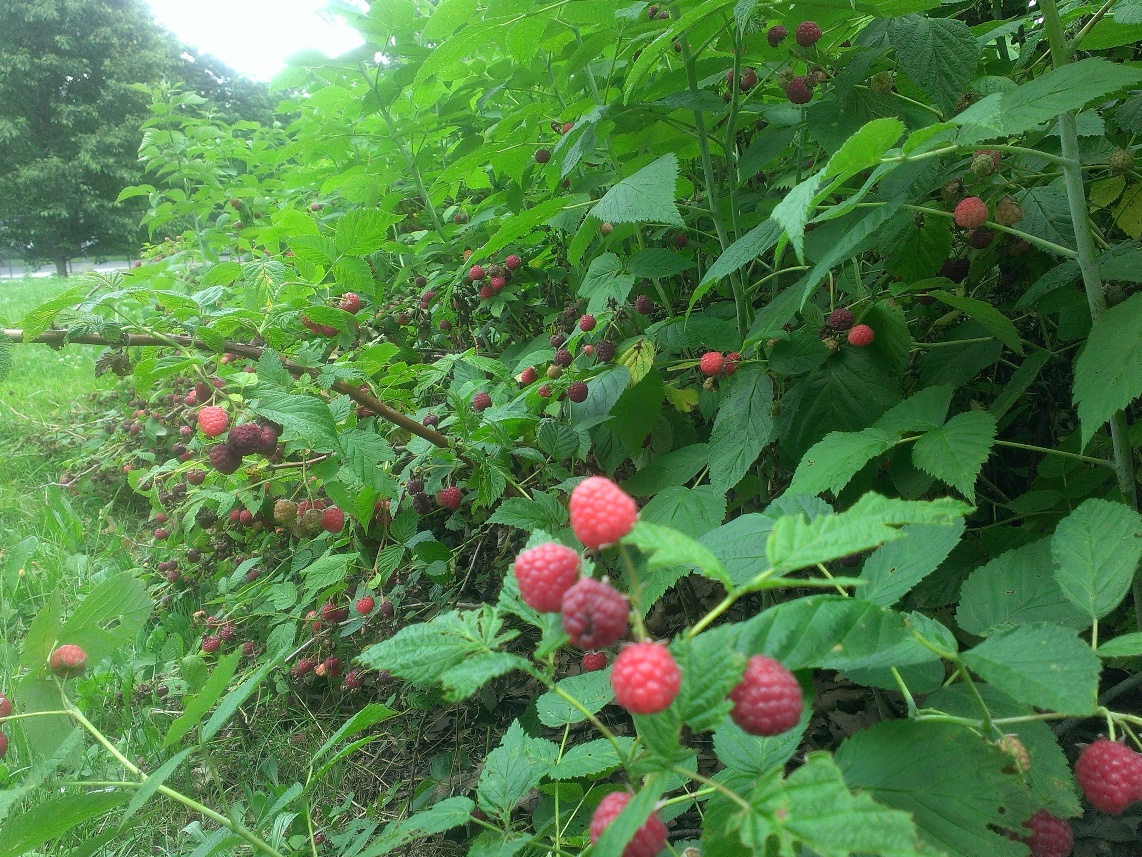
In 2015, there were significant decreases in yield among bramble berries (raspberries and blackberries, mostly), which POP attributed partially to a lack of proper pruning and maintenance during the previous winter. As a result, POP Staff made a push during the 2016 pruning season for orchard partners to increase care for these plants, and the increased yields this year suggest that this work paid off. This is strong evidence that survey data is important in guiding actions to improve overall orchard health and production.
Culinary and medicinal herbs were tracked a bit more this year, but education and encouragement to partners to harvest and track yields from these plants must continue. Mint, lemon balm, sage, and oregano were highest harvested plants.
Production Challenges and Recommendations
In 2016, 22 respondents believed they had extensive management problems in their orchard, and 24 believe they did not. However, 59% of respondents reported that their community orchards were easier to maintain in 2016 than in previous years.
Specific incidents of pest and disease problems are only as accurate as a partner’s ability to identify them, so it’s also likely that there are more problems than were reported. Nonetheless, reporting seems to have improved in 2016 so that we have enhanced ability to know what to continue education around. Four orchards report they had no problems at all. The highest incidence of challenges were squirrel (22), insect pests (18), plant diseases (16), peach leaf curl (15), birds (13), and mosquitos (13). The most common problems reported were very similar in number to the previous year, so POP will continue to educate around these specific challenges as much as possible.
Dedicating more staff time to on-site pest and disease management at a few key partner orchards in 2017 is another pilot program in development. A schedule will be set up with partners to travel to various orchards, apply compost tea and other holistic orchard sprays.
Expanding Orchard and Permaculture Education Efforts
89% of respondents are interested in participating in a Community Orchardist Training Course. As a result of this enthusiasm, we’ve decided to design and offer a new series called POP CORE (Community Orchardist Resilience Education) for all partners and volunteer orchard liaisons throughout the month of March!
Orchard Demographics
Although challenging to assess, we feel it’s important that POP understands a bit more about the populations that participate in and live around community orchards. To start, we asked about income this year. On average, orchard partners reported that 66% of populations they serve would qualify as low-income. Depending on the partner, these numbers were generated via census data, FMNP voucher collection, HUD criteria, and well-informed estimates. For some sites with public access and a larger draw from out-of-neighborhood visitors, these numbers are harder to assess.
Organizational Improvement
On a scale from 1 to 10, respondents’ average rating of POP as an overall organization was a 9.1! Almost every single respondent is pleased with their relationship with their volunteer orchard liaison, and overwhelmingly partners believe that POP staff are supportive and easy to reach.
Looking back on the previous year provides great encouragement for the coming season, and we will continue to use this information to improve our programming and outreach long into the future!
SUPPORT US! If you found this entry useful, informative, or inspiring, please consider a donation of any size to help POP in planting and supporting community orchards in Philadelphia: phillyorchards.org/donate.