POP surveys all of our orchard partners at season’s end and we like to share what we’ve learned. Each year, we ask partners about their orchard successes and challenges, orchard value, community involvement, yields, distribution methods, how we perform as partners, our educational offerings, and how to improve the services POP provides. It may not come as a big surprise, but partner participation was down in 2020, as we all continued to deal with the ongoing pandemic. In total, 43 of 65 POP partners (66%) participated in our annual Partner Survey in November and December 2020, down from 80% participation in previous years.
Orchard Value
We have asked questions each year intended to help understand what our partners value most about their orchards. This year, “Beauty and Neighborhood Greening” and “Educational Opportunities” received the most votes for “Highest Value” as folks found themselves seeking nature breaks during Covid, while “Community Health & Nutrition” and “Environmental Impact received the most votes for “High Value”. Very little votes were cast for “Low Value” and “Lowest Value” with the most votes of “Lowest Value” being attributed to “Gathering and Community Space” at 21% of responses indicating this, likely due to the avoidance of gathering in 2021.
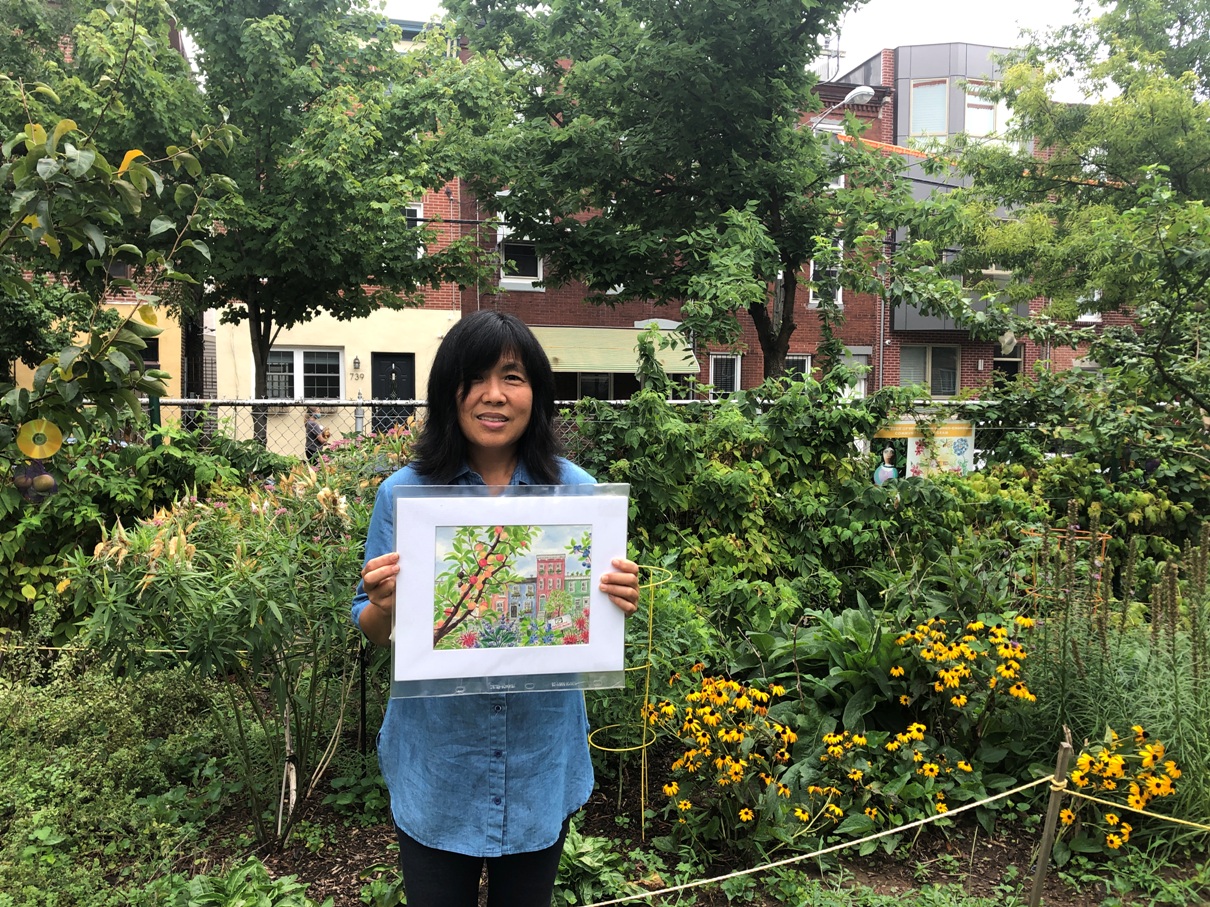
The survey’s request for stories illustrating the value of the orchard always provide some heartening responses that help provide qualitative support for the impact of POP’s work. During a year that was challenging for many reasons, urban orchards served as an outdoor respite and constructive activity, contributing to local food security. Repeating themes for 2021 include the relief of outside time and beauty for community members (18), a covid activity assisting with mental health (20), providing necessary food to community members (15), the exciting event of plants fruiting (7), educational moments (5), and for a few sites, youth engagement amidst Covid restrictions (3). Check out some of our favorite partner testimonials shared in our earlier 2020 Partner Stories blog post.
Community Involvement
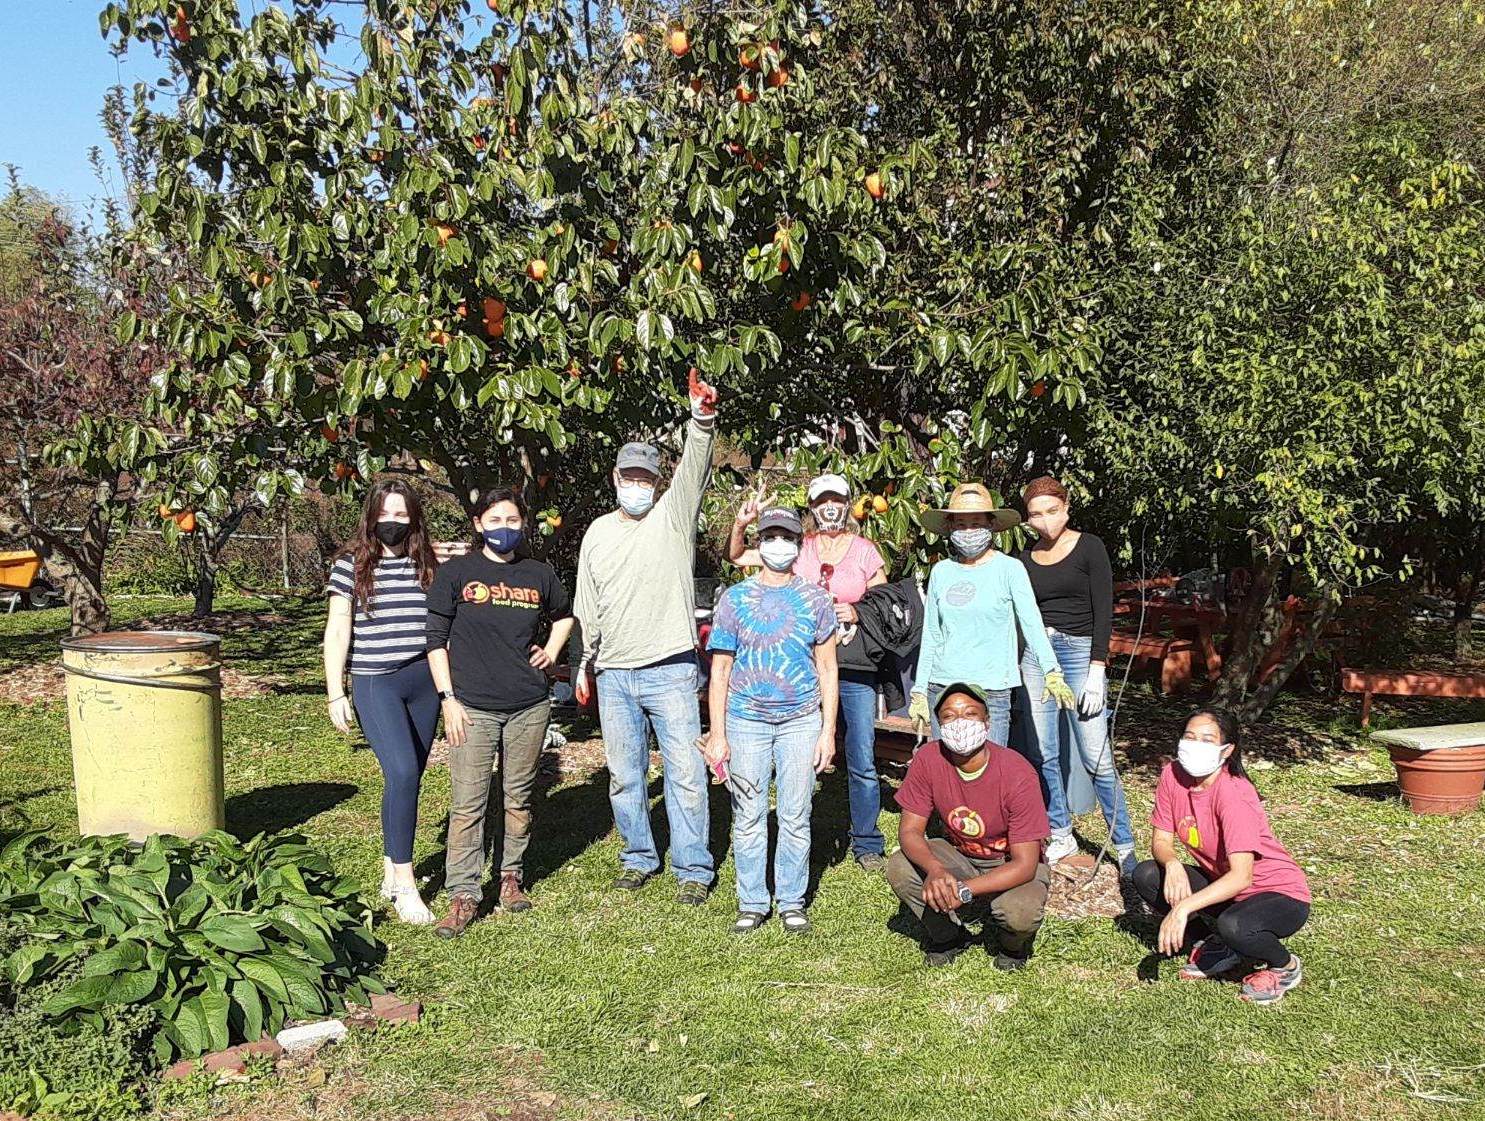
A set of questions were asked to assess the number of people involved with and impacted by our orchards. As expected, participation numbers were down significantly, especially in the case of public programs, due to pandemic restrictions. Surveys reported:
- A total of 287 people participated at least monthly throughout the city, which is below average but a significant safe and essential activity still embraced by many in 2021. Prior levels were 337 in 2019 and 428 in 2018.
- 745 people were reported to have participated at least once in orchard care this year. This number is significantly lower than prior levels as POP and partners cancelled traditional volunteer workdays, conducted one-on-one visits, and eventually reintroduced very small workdays. Prior levels were 3,072 in 2019 and 2,404 in 2018.
- 83% of respondents tended to their orchards at least monthly, which is a huge increase from prior years (40% in 2019, 46% in 2018). 40% of these partners held organized monthly workdays. Monthly orchard attention and volunteer workdays is a main component of POP’s recommended maintenance plan, so this is very encouraging, and while not all POP partners were able to interact with their gardens this past year, many of them kept on by themselves or with small groups and Covid safety precautions.
- While lower than prior years, partners reported that 3,895 people tasted something grown in a partner orchard last year, a Covid dip in contact, yet still significant, as compared to 6,532 in 2019 and 4,435 in 2018.
- Similarly, 3,699 people used a POP partner orchard as a gathering space compared to 13,225 in 2019 and 8,923 in 2018. This correlates with limited gathering recommendations, while outdoor time and gardens served many with a much needed respite and nature break.
- 544 people were reported to have participated in educational programs at orchards this season, which is significantly lower than 4,031 in 2019 and 7,190 in 2018. We hope and look forward to the return and rebound of garden education!
While education, maintenance and yields were down, some did persist or in some cases increase in 2020’s year of Covid and civil unrest. Positive effects on mental health may have been the biggest reward of community orchards in 2020 coming from being able to maintain a connection to nature, do something constructive, and find some community and social connection.
Obviously everyone was thrown off by 2020 events, and garden engagement took a dip for some while increased for others. It is encouraging to find that activity continued safely by those that were able to and comfortable doing so, and that it served as a vital outdoor respite, productive activity and source of food during this time. In 2020, 62% of respondents indicate Covid-19 resulted in less care for their orchards, while 38% report an increase in orchard care during the pandemic, and 21% indicate orchard care was unaffected. 75% of responses state their orchards were not easier to maintain this year and 57% of those responses cite Covid related reasons including reduced access, reduced staff, reduced help, people cancelling, and severe delays in resuming garden attention.
Distribution
Distribution methods vary greatly from one group to another, as expected from distribution plans submitted in partner applications and the varying missions of partner orchards. There are orchard partners whose yields are 100% harvested directly by or distributed to community members for free, some yields contribute to a variety of partners’ farmers markets and CSA memberships, some partners turn yields into value added products, and some yields are completely or partially donated to emergency food services.
Similar to past years, about half (49%) of all recorded harvest yields at POP partner orchards were made available to community members for free (48% in 2019, 51.5% in 2018). If averaging distribution methods across all partners, each partner weighted equally, 61% of partner harvests are slated to be harvested directly by or distributed to community members for free either onsite or through outside emergency food service organizations (69% in 2019, 70% in 2018). Similar to last year, when accounting for production levels reported by each partner within their distribution methods, the scales are tipped heavily by 7 partners (16%) reporting much higher harvest weights than the majority of POP partners. It may be important to note that most of these 8 partners have well established plants, higher reported levels of maintenance, staff with hours dedicated to the orchard, and include well established youth and non-youth based farmer’s market endeavors.
Taking into account yields and distribution methods reported by each partner, total produce yielded by community orchards in 2020 was distributed in the following manner:
- 25% was harvested for free by community members (26% 2019, 31% 2018)
- 18% was distributed for free to community members by the partner organization (18% 2019, 16% 2018)
- 3% was processed into value-added products (2% 2019, 4% 2018)
- 30% was sold at on-site farmstands (25% 2019, 24% 2018)
- 6% was sold off-site at farmers’ markets (11% 2019, 7% 2018)
- 10% of ripe fruit went unharvested or was lost to pest and disease (7% 2019, 9% 2018)
- 6% was donated to emergency food pantries, and (4% 2019, 4% 2018)
- 1% was sold via Community Supported Agriculture (CSA) shares (6% 2019, 4% 2018)
Most of these percentages are very similar to last year’s, except that the percentage sold at on-site farm stands has continued to increase again for the 4th year in a row. It should also be noted that the on-site farm stands led by our urban farm partners generally feature very affordable prices to accommodate their communities’ needs and most urban markets offer sales through FMNP or SNAP programs, meaning additional free distribution to Philadelphia residents in need while providing work and supporting a local food system and economy.
Orchard Production
This section is for the evaluation of yield by plant type, gathering data on actual production levels where available, and to discover production problems with which our partners need the most assistance. Total orchard production of 2,924 lbs was reported in 2020 (4437 lbs in 2019, 3580 lbs in 2018). It is difficult to accurately track yield between spaces that are used in a wide variety of ways by different partners, including public spaces, organizations with limited or no staff, and where free harvest from community members is encouraged. 2020 difficulties may have affected record keeping and lower partner responses may have greatly affected reported yields. However, 15 sites reported contributing to local food security in their partner stories.
POP is still taking measures to provide partners with more tools to aid in estimation including harvest tracking worksheets with volume-to-weight conversion charts. We often gift produce scales to partners as part of our annual tool giveaway. We are hopeful that our new harvest tracking tools will encourage and help partners to measure their production. POP orchards include a wide variety of lesser known edible companion plants, whose uses may not be immediately familiar. Of total respondents, 35% would like more assistance in learning how to make use of their orchard plants (38% in 2019, 42% in 2018). This could be an indicator that POP’s educational efforts have had a lasting increased confidence in harvest utilization, while perhaps there is still a deeper level of understanding to achieve for some.
Based on 2020 survey analysis of tree fruits, figs and pawpaws were by far the highest producers, followed by plums, sweet cherries, pie cherries, asian pears, and peaches in that order. In 2019 pawpaws, peaches/nectarines, asian pears, and pie cherries were the highest producers followed closely by persimmons, sweet cherries, figs and plums. Of surveyed fruit and nut trees, we saw a decrease in reported yield for 13 out of 19 crops, with serviceberries, persimmons and European pears having the most significant decreases. Before moving forward here, we should note again that there was a 14% decrease in survey response and 62% of responses indicated that Covid resulted in less care for their spaces in 2020. This is something to consider reflecting dips in yield, although pre-Covid reported yields per tree were also low in comparison to commercial orchards, including separating data for orchards over 6 years old.
Poundage from fruit and nut trees based on reported yields are as follows (bolded are significant changes in yield):
- Peaches/nectarines: 124 pounds (254-2019, 286-2018) -50% decrease from last year’s harvest
- Serviceberries: 20.25 pounds (86.6-2019, 71.5-2018) -76.6% perhaps due to rust and harvest being shortly after Covid-19 was announced
- Plums: 205.6 pounds (194.5-2019, 337-2018) +5.6%
- Sweet cherries: 154.25 pounds (218-2019, 137-2018) -29.2%
- Apples: 91.25 pounds (130.5-2019, 145.5-2018) -29.8%
- Figs: 403.5 pounds (184.5-2019, 232.5-2018) +118.7% a major increase after a 2019 and 2018 dip in production
- Persimmons: 24.2 pounds (233-2019, 77.5-2018) -89.6% perhaps not harvested or because of missing survey responses
- Asian pears: 143.6 pounds (335.9-2019, 225-2018) -57.1%
- Mulberries: 35.5 pounds (29-2019, 20-2018) +22.4%
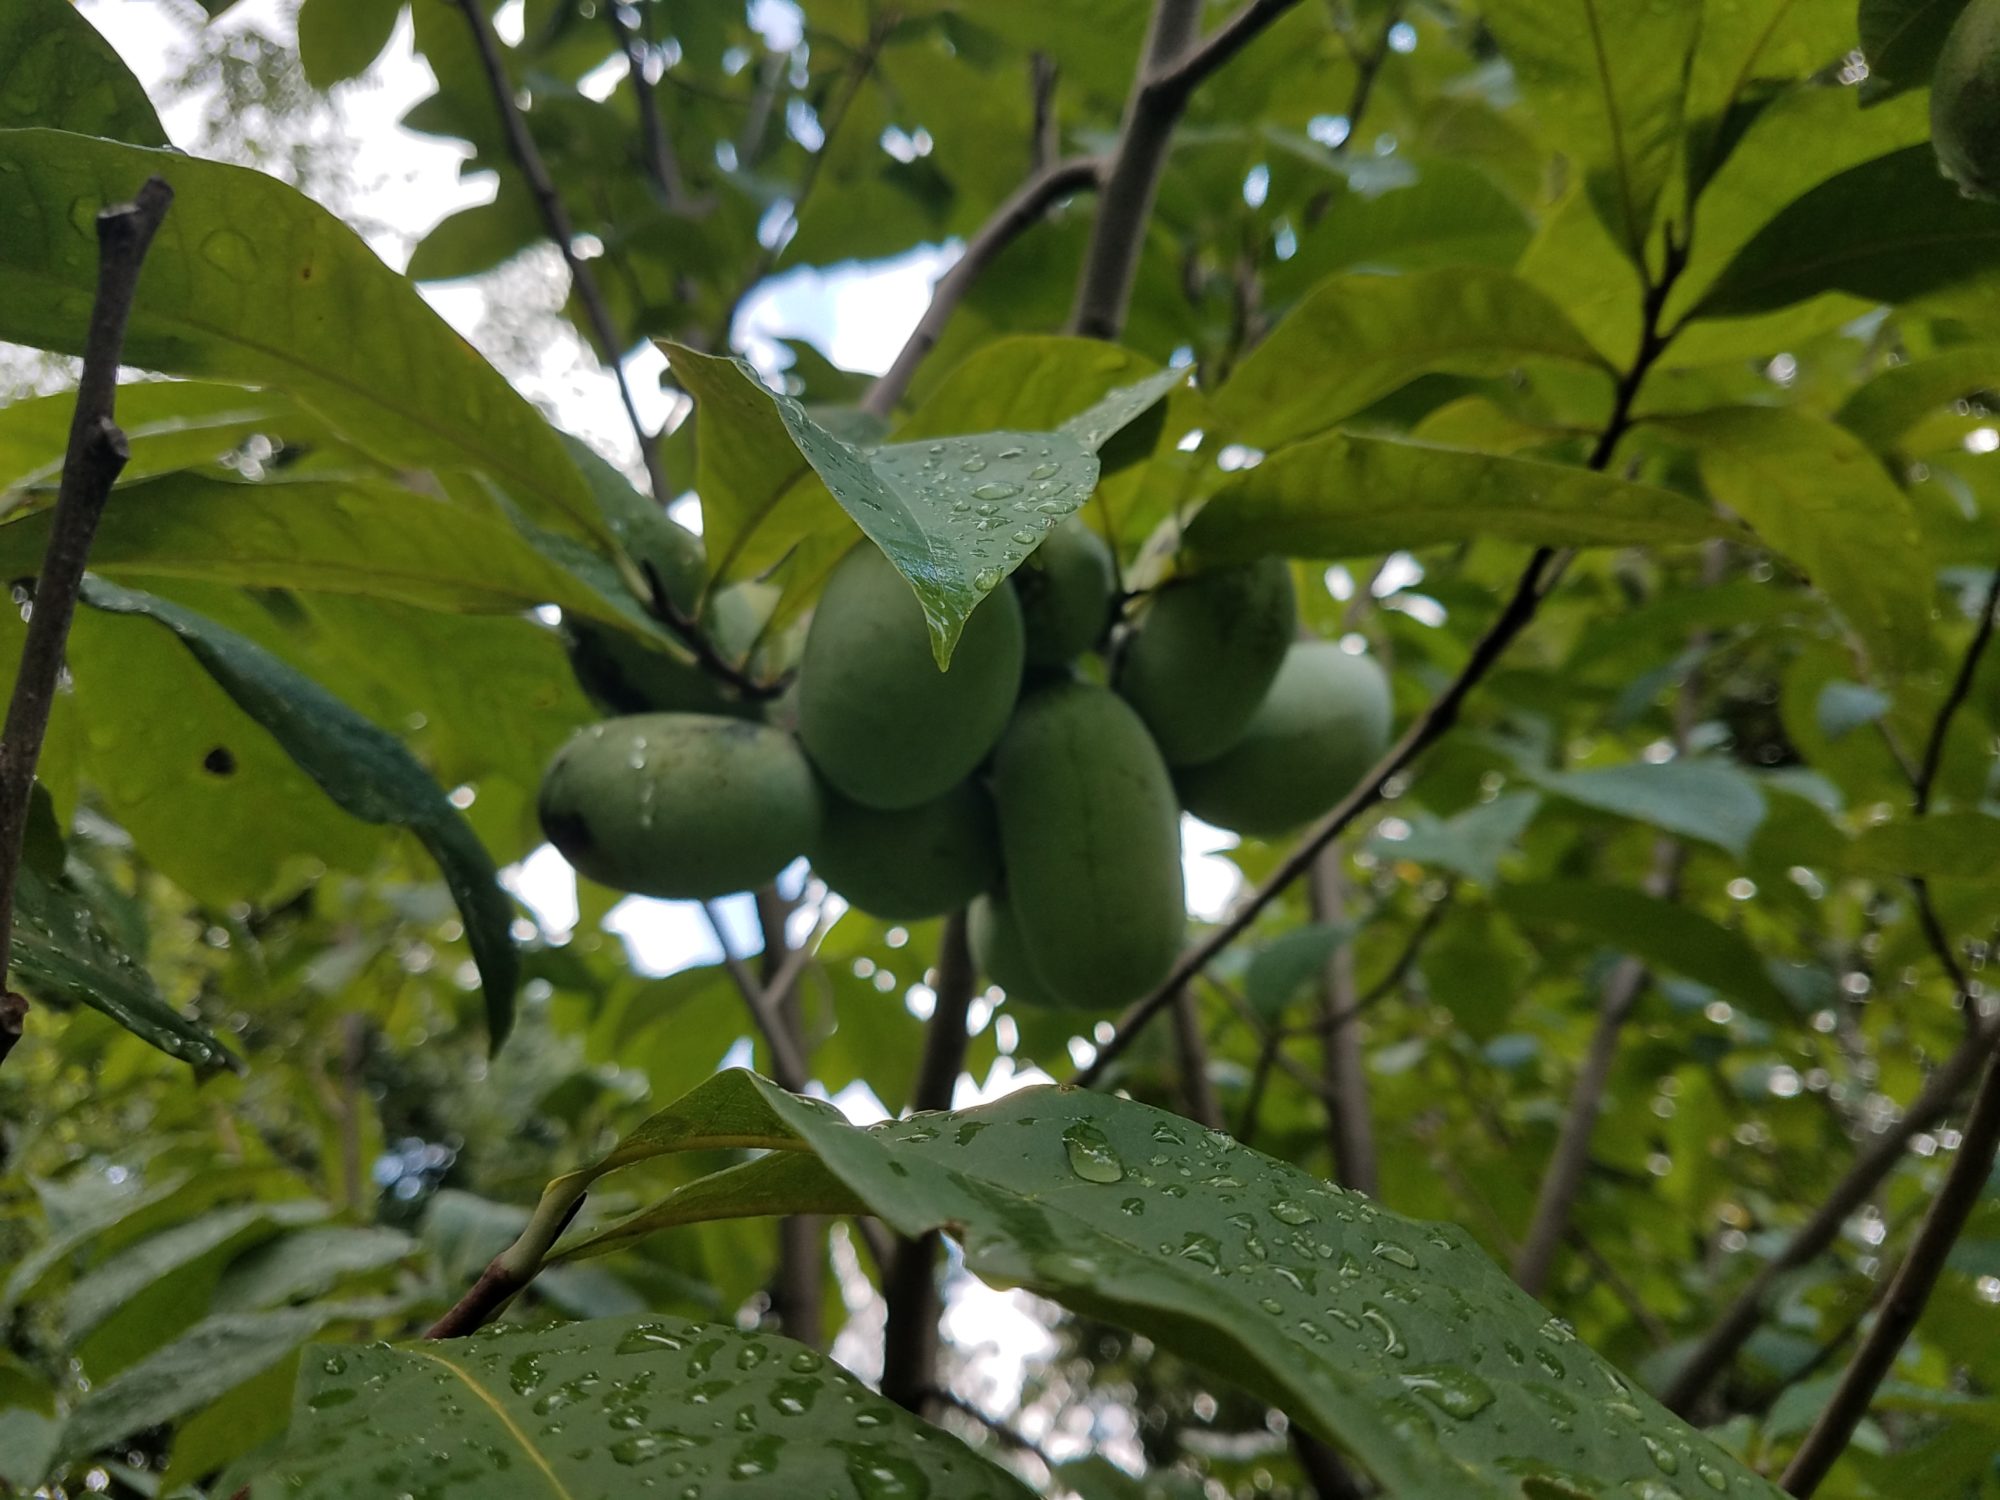
- Paw paws: 311.5 pounds (539.8-2019, 239-2018) -42.3%
- European Pears: 35.6 pounds (137.1-2019, 52-2018) -74%
- Pie cherries: 144.5 pounds (236.2-2019, 187.8-2018) -38.8%
- Jujubes: 2.02 pounds (14.5-2019, 6-2018) -86%
- Medlar: 5 pounds (4-2019, 0-2018) +25%
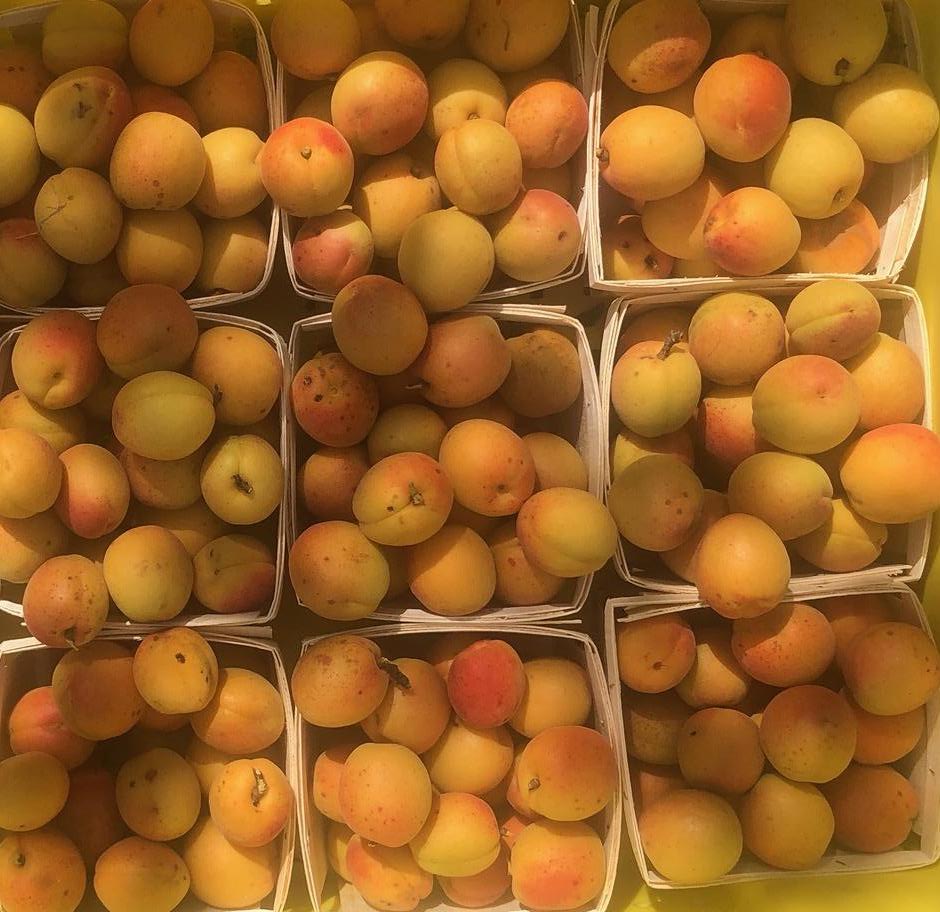
- Apricots: 6 pounds (60-2019, 23-2018) -90%
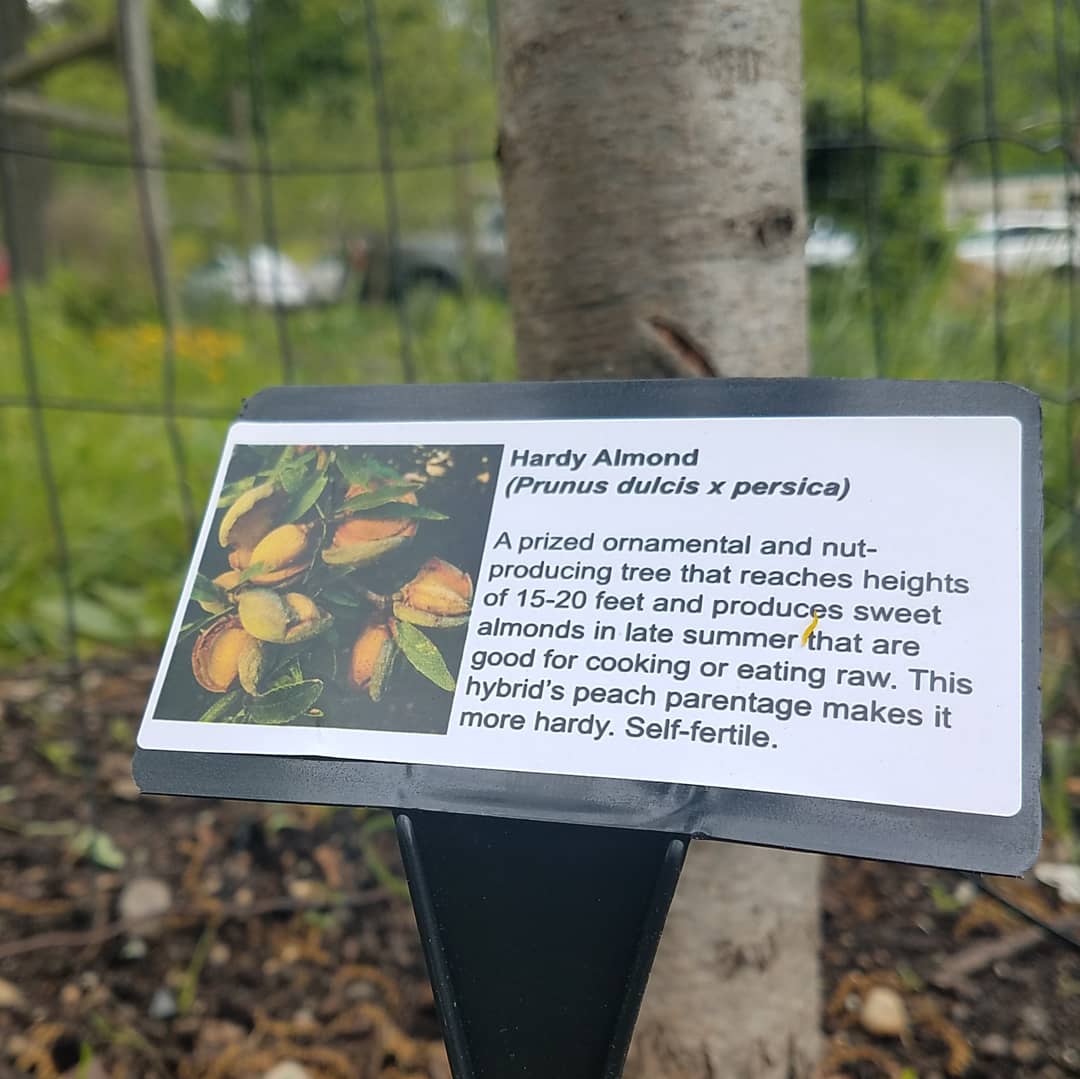
- Almonds: 23 pounds (15.4-2019, 22-2018) +49.4%
- Hazelnuts: 11 pounds (90.25-2019, 105-2018) -87.8%
Several berry and perennial vegetable yields were tracked again. Overall we saw an decrease in yields and/or usage of smaller fruits and perennial vegetables in the orchard this year by 290.1 lbs (after an increase of 185lbs in 2019). Eight out of sixteen crops tracked saw decreases of over 65%. While this major decrease in yield or utilization seems to be a big theme for our partners in 2020, blackberries saw a 70.1% increase.
Poundage from brambles, shrubs, vines, and perennial vegetables based on reported yields are as follows (bolded are best performers or significant changes in yield):
- Raspberries: 138.6 pounds (167.3-2019, 200.5-2018) – 17.2% decrease from last year’s harvest
- Strawberries: 189 pounds (264, 2019, 224-2018) – 28.4%
- Blackberries: 251 pounds (147.6-2019, 191-2018) + 70.1%
- Grapes: 61 pounds (197.8-2019, 118.6-2018) – 69.2%
- Currants: 5.25 pounds (17.75-2019, 17.25-2018) – 70.4%
- Gooseberries: 10.6 pounds (38-2019, 56.25-2018) – 72.1%
- Elderberries: 32 pounds (42.5-2019, 31-2018) – 24.7%
- Blueberries: 39 (51-2019, 52-2018) – 23.5%
- Goumis: 12.25 pounds (10.9-2019, 15-2018) + 12.4%
- Hardy kiwis: 31.3 pounds (32-2019, 25-2018) – 2.2%
- Asparagus: 36.5 pounds (105-2019, 48.5-2018) – 65.2%
- Rhubarb: 35lbs (111-2019, 56-2018) – 68.5%
- Nanking Cherries: 8 pounds (65.1-2019, 32-2018) – 87.7%
Culinary and medicinal herbs were tracked again this year. Reported yields of herbs fluctuated, while mint, lemon balm, thyme, oregano and fennel remain the most utilized. We saw large decreases in usage across the board last year. We do love to hear of partners making use of these herbs that provide ecological benefits to the holistic orchard system and will continue to provide information and workshops. Fennel, mint, and lemon balm continue to be among the highest reported yields, perhaps reflecting their tendency to spread and quickly increase their offerings. Perhaps the comfrey craze really has subsided!
Poundage from culinary and medicinal herbs based on reported yields are as follows (bolded are significant changes in yield):
- Mint: 72.7 pounds (100-2019, 88-2018) – 27.3% decrease from last year’s harvest
- Lemon balm: 40.9 pounds (30.5-2019, 45.6-2018) + 34.1%
- Oregano: 26.6 pounds (33.7-2019, 40-2018) – 21.1%
- Thyme: 34.5 pounds (25-2019, 36.75-2018) + 38%
- Anise Hyssop: 16 pounds (16.5-2019, 27-2018)- 3%
- Chamomile: 5.75 pounds (9.25-2019, 17-2018) – 37.8%
- Fennel: 40.5 pounds (39-2019, 58-2018) + 3.8%
- Sorrel: 13 pounds (6-2019, 14-2018) + 116.7%
- Comfrey: 3.3 pounds (12-2019, 14.5-2018) – 72.5%
For the third time, we also attempted to quantify the average productivity of each type of fruit tree. While it is difficult for us to accurately do this across all partner sites, our data does inform us what plants are producing better than others and are utilized by partners, reflected in their yield reporting. Totaling yields and number of trees across partners 6 years and older, pawpaws, figs, and sweet cherries were on average by far the highest yielding and utilized fruits in 2020 at POP partner sites (persimmons in 2019 and plums in 2018). Mulberries, plums and peaches follow (Apricots, pawpaws and peaches in 2019; peaches and pie cherries in 2018). A next tier of productivity occurs with pie cherries and Asian pears (Asian pears, pie cherries, sweet cherries, European pears, plums and mulberries in 2019; sweet cherries, pawpaws, and hardy almonds in 2018). Among orchards 5 years and younger, figs showed the highest return per plant by far (pie cherries in 2019) followed by hardy almonds, peaches, and plums (peaches in 2019). These young orchards need time to grow before seeing significant production, while nanking cherries and grapes also show signs of early yields.
Production Challenges and Recommendations
When asked to rate challenges in the orchard from 1-5, responses from partners again averaged out to 3.5, which is slightly more challenging than the past few years reported as 3 out of 5. 30% of respondents believe it was easier to maintain their orchards in 2020 than last year (compared to 56% in 2019). When comparing frequency of orchard care against rate of difficulty, partners that maintain their orchards at least once per month rated difficulty at an average of 3.5, while partners that maintain their orchards less average a difficulty rating of 4. Hopefully it is obvious that more regular maintenance results in easier to care for spaces. When asked what barriers there were to regular orchard maintenance, answers overwhelmingly included reduced maintenance due to Covid restrictions, amount of time available, people and volunteer power, staff transitions, other responsibilities and a need for more training.
According to survey responses, 11 of our partners (26%) are going through definite staffing or organizational transitions (25% in 2019), while we are aware of a handful of additional staff transitions announced after the survey. This clearly demonstrates high turnover rates within the field of urban agriculture which likely relates to the ability of organizations to employ full time and provide sustainable wages and benefits. POP support is helpful in these times of transition, as we are able to provide orchard history, orientation, and training to staff that are onboarding to orchard care as a new role.
As you will note below, the most frequently identified challenge is the amount of people involved due to Covid, which is no surprise. Dovetailing this new challenge are the persistent pre-existing challenges of plant diseases, insect pests, the amount of time available and other responsibilities, which have been mainstays as top challenges over the years. Having noticed this over the years, POP has made efforts to create new resources and reference materials to make community orchard management easier, including recommended practices for community and volunteer organizing, pest and disease guides, and an orchard care calendar. We have further intentions of making virtual POPCORE class recordings permanently available (a beta version is currently available to partners and volunteers) and further developing and making additional grower, pest and disease guides. Focusing our energy on further empowering our orchard partners with knowledge, supplies, and recommendations seems may be the best use of our resources.
Specific challenges identified are as follows, based on the number of partners reporting each issue (significant increases or decreases bolded):
- 25 amount of people involved due to Covid
- 23 plant diseases (19-2019, 17-2018, more specifics below)
- 21 amount of time available/other responsibilities (25-2019, 31-2018)
- 21 insect pests (18-2019, 18-2018, more specifics below)
- 18 weeds (18-2019, 17-2018)
- 18 squirrels (14-2019, 25-2018)
- 16 my own availability due to Covid
- 15 availability of other staff due to Covid
- 14 site access due to Covid
- 13 birds (10-2019, 13-2017)
- 10 watering (13-2019, 1-2017)
- 10 staffing transitions (10-2019, 14 2018)
- 10 attendance at volunteer days (10-2019, 4-2018)
- 9 lack of knowledge (11-2019, 12-2018)
- 7 theft of fruit (8-2019, 6-2018)
- 6 groundhogs (6-2019, 5-2018)
- 5 vandalism/defacement/human damage (6-2019, 10-2017)
- 3 deer (3-2019, 4-2018)
Pest and disease identification and management is likely the trickiest areas of orcharding that takes time and resources to become well versed in. Specific incidents of pest and disease problems reported are listed below and the accuracy of this comes with the ability to identify them. It is likely that there are more problems than were reported, but reporting seems to have improved as we continue to send out tips seasonally, improve POPCORE 2, and publish information in the form of guides. From survey data and anecdotally, we find the pest and disease resources we’ve invested in producing are valued, easier to digest than other available materials and partners think we should produce more. To these ends, we could continue learning and equipping ourselves to provide distilled and digestible resources and workshops on pest, disease, and organic and holistic sprays for those partners with the capacity to take this up.
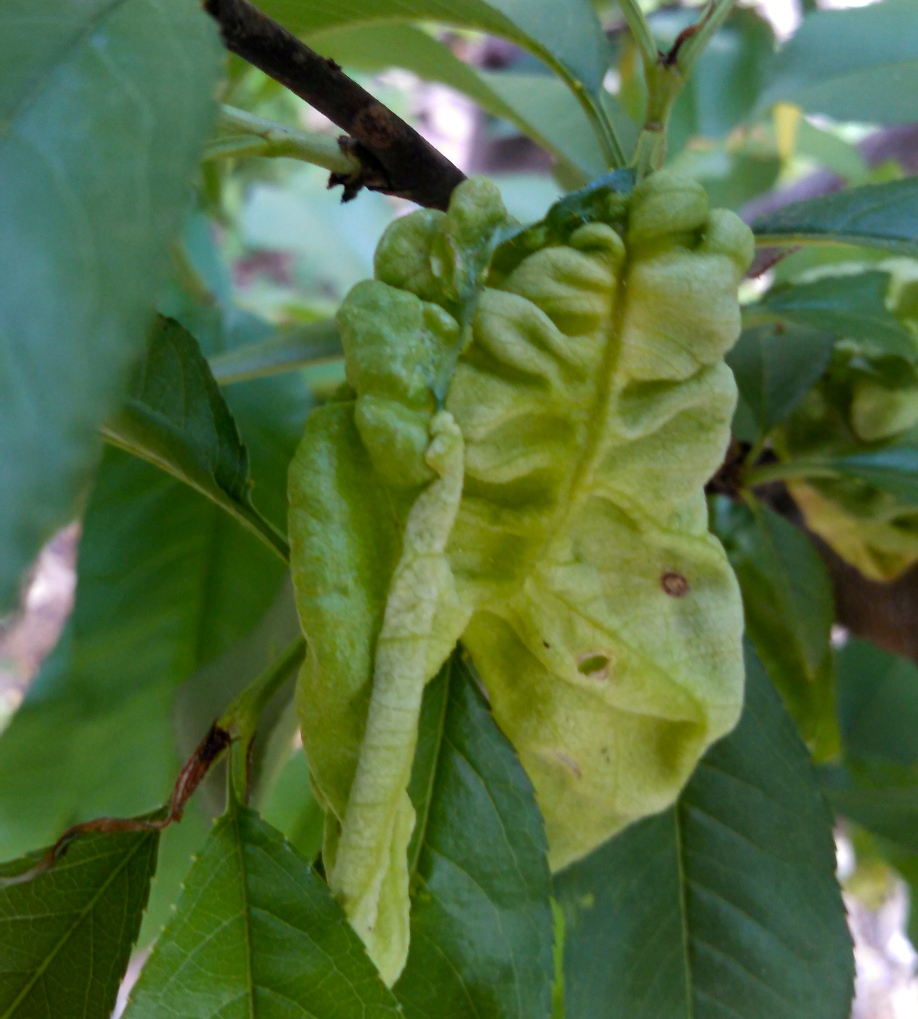
Highest reported pests and diseases are still the most common and easily identifiable diseases. It is obvious that spotted lanternfly are everywhere, while it is still largely unknown what effects this has on fruit production. 2020 was a huge year for peach leaf curl and brown rot fungal diseases, while fire blight levels remained the same and significant. Aphids, oriental fruit moth, and mosquitos were the highest reported next to unknown bug damage. On average, partners feel that 23% of their yield is lost to pests and disease this year (17.4% in 2019, 16.5% in 2018), and that 15% is lost to birds and squirrels (14.5% in 2019, 19% in 2018). Partner conditions and plants vary greatly, but this is a significant amount of perceived yield lost, while it is likely much more considering the yield levels reported in mature orchards.
Specific pests identified at partner orchards (significant changes are in bold)
- 28 spotted lanternfly (22-2019)
- 15 aphid (12-2019, 9-2018)
- 10 oriental fruit moth (7-2019, 6-2018)
- 8 mosquito (12-2019, 7-2018) *not a serious issue for fruit production
- 7 unknown (4-2019, 8-2018)
- 6 plum curculio (6-2019, 4-2018)
- 6 tent caterpillar (12-2019, 11-2018) *not a serious issue for fruit production
- 6 peach tree borer (3-2019, 3-2018)
- 4 stink bug (5-2019, 1-2018)
- 3 scale (6-2019, 4-2018)
- 3 codling moth (5-2019, 4-2018)
- 2 peach twig borer (0-2019, 1-2018)
- 2 spotted wing drosophila
- 1 tree cricket
- 1 apple tree borer (1-2019, 0-2018)
- 1 harlequin beetle (1-2019, 1-2018)
- 1 sawfly (0-2019, 0-2018)
- 1 mites (0-2019, 0-2018)
- 1 leafrollers (0-2019, 0-2018)
- 1 tarnished plant bug (0-2019, 0-2018)
Specific diseases identified at partner orchards (significant changes are in bold)
- 20 peach leaf curl (9-2019, 9-2018)
- 11 brown rot (9-2019, 7-2018)
- 10 fire blight (10-2019, 13-2018) *spreading and hard to get rid of
- 9 leaf spot (10-2019, 7-2018)
- 7 powdery mildew (7-2019, 5-2018)
- 6 pear rust (3-2019)
- 6 unknown (4-2019, 8-2018)
- 4 cedar apple rust (6-2019, 4-2018)
- 4 black rot (5-2019, 5-2018)
- 3 bacterial canker (3-2019)
- 3 gummosis (3-2019, 7-2018)
- 2 serviceberry rust (2-2019) *noticed becoming widespread
- 2 scab (1-2019, 1-2018)
- 2 Japanese beetle (5-2019, 2-2018)
- 1 bacterial spot (0-2019, 1-2018)
- 1 plum pocket (0-2019, 0-2018)
- 1 black knot (1-2019, 0-2018)
- 1 leaf scald (1-2019, 0-2018)
When asked if partners would like more assistance in identifying challenges, 11 partners said yes, 16 said somewhat , 8 said no, and 6 were unsure. This means at least 63% of respondents (50% 2019, 61.5% in 2018) think they would benefit from additional assistance in identifying challenges. POP will continue to build both its published materials and online presence with detailed information and photographs to guide partners through production challenges, take note of which production challenges need better guidance, and point partners towards supplemental resources as best as possible to assist partners towards plant productivity through our quarterly visits, remote advice and educational resources. Information is disseminated through POP’s blog, the Philadelphia Orchard Group Listserv, POP’s youtube channel, in-person workshops and workdays, our website’s resource page, and physical copies of many publications. It was noted last year that perhaps our challenge might be to encourage our partners to utilize the tools we are able to provide and improve our delivery and orientation to these resources, while survey responses may indicate that the prepackaged guides may be more readily utilized by partners on the go as opposed to reading emails and searching our blog.
Orchard Education Efforts
In March 2020, POP hosted the first two sessions of our 4-part Community Orchard Resilience Education (POPCORE) workshop series, but had to cancel the remainder due to Covid. The inability to hold in person programming last year allowed POP to fulfill a long time goal of developing virtual and video-based educational programs. In 2020, POP created is own youtube channel, piloted several educational videos, and in Feb 2021 debuted the virtual version of our POPCORE education course.
According to prior partner surveys, at least 85% of respondents were interested in participating in POPCORE. 34% of 2020 respondents still haven’t attended any POPCORE classes, which is much less than 64% that hadn’t in 2019. Winter Pruning is our highest attended class at 26 partners (17 in 2019), while attendance declines to 17 at Pest and Disease (11 in 2019), 9 at Plants and Usage (7 in 2019), and 13 at Permaculture (8 in 2019). While we typically offer the course both all at once in March, and again throughout the season, this trend in attendance is a natural reflection of the business of the growing season and corresponding grower availability, with more gardeners willing and able to attend the first workshop in Winter.
Over the past few years, we have considered making virtual workshops available to reach more of our partners, and Covid has pushed us to make this effort. When asked after the arrival of Covid, 77% of partner respondents would definitely attend POPCORE virtually. All four courses were offered virtually in March 2021, with higher attendance than has typically been seen for in-person workshops, and we are working to post them permanently online while considering a return to in person POPCORE. It is very obvious that virtual POPCORE classes will reach more of our partners and the public quicker than only offering in person options. When asked about attendance in a pandemic free world, 49% of respondents indicated they’d be most likely to complete the full course offering through a combination of in person and virtual options, while 44% are most likely to complete this in person and 7% are likely to complete this through virtual options only.
In the previous years, we had expanded upon our effort to educate partners and the public about unusual fruit through our POP Harvest gleaning program and POP HarvestED workshop series. This program brings in community teachers to lead gleaning workshops focused on the end use of lesser known fruits, nuts, and herbs that are widely available through POP orchards and the Philadelphia region. This past season we decided not to host in person harvest events or workshops while we pivoted towards the production of maps that highlight edible street trees using City of Philadelphia data, producing blog posts, and posting to our POPHarvest email list. When asked, 51% of partner respondents would like to attend these workshops in the future, while 33% might and 14% are not sure specifically because of Covid. These interest levels are lower than previous seasons (86% in 2019 and 96% in 2018). When asked point blank, 65% of partner responses indicate they do not need further assistance in learning how to use plants in their garden, while 35% do. Specific plants of interest include native plants; unusual fruits, nuts and herbs; processing tools; medicinal plants; figs; ribes; goumis; infused soaps and oils. We intend to continue this series with 8-10 workshops, guest blogs and/or virtual classes in 2021.
This past year, we asked partners to rate the value of various educational areas of focus beyond POP HarvestEd. Partner interest and need for harvest end use education remains, while it does seem to have significantly dropped, being rated as high value by only 19% of respondents and moderate value by 72%. Comparatively, partner responses indicate a high value for education around pest and disease management (81%), orchard sprays (63%), and grower techniques (67%). This makes sense because of the nature of pest and disease pressure in our area and climate for common fruits that many partners struggle with planted in their orchards. Very few respondents rated any of these areas of focus as not at all valuable. POP is taking steps to meet this demand through our virtual offering of POPCORE 2, production of a Bramble Pest & Disease guide, revamping our Common Tree Fruit Pest & Disease guides to include more management recommendations (hopefully by Spring 2022), piloting more intensive management for our worst and most common issues including Brown Rot and Oriental Fruit Moth to report on, and aiming to pilot videos that will highlight grower techniques and grower interviews for various tree crops. The production of electronic materials for these topics will help this information reach our partners and can be returned to for reference, while a return to in person options will be embraced and preferred by a portion of our constituents.
POP Publications and Resources
POP has produced a variety of written orchard resources with the goal of better helping our partners, and we ask our partners about their value and use. POP sends out orchard care tips, pest and disease identification, as well as management information through our blog and email lists. When asked, 19% are always reading these (10% in 2019), 40% are usually (34% in 2019), 30% sometimes (46% in 2019), 7% do not read these (8% in 2019), and 5% are not on the list. When polled, 40% of our partners still do not search our website’s blog when they discover an issue (50% in 2019), though 16% often do (22 in 2019) and 44% occasionally do (32% in 2019). These numbers are slightly better than last year, and POP should continue to remind our partners this is available while considering modes of delivery other than the blog and emails.
In 2018, POP produced pest and disease identification guides for Common Fruits and made a larger effort to distribute physical copies to partners in 2019. When asked, 72% of respondents found these useful (48% in 2019, 60% in 2018) and 26% hadn’t seen them (44% in 2019, 35% in 2018). No one did not find these useful (1 person in 2019 and 2018) and there was 1 request for Spanish. 51% of partners indicate needing a copy of this, whether this is their first copy or an additional one (50% in 2019, 56% in 2018). Even with this resource, when asked what they need stronger guidance on, 11 out of 20 write-ins identified needing stronger guidance on pest and disease management. It is a POP goal to try to release a bramble pest and disease guide in 2021, and to make fuller versions of the Common Fruit Tree Pest and Disease Guides by Spring of 2022.
71% of partner respondents indicated they would like plant identification signs and these are being delivered and installed at partner sites across the city in 2021. Additionally, 24% of partner respondents would like a community orchard or food forest yard sign, which are also printed and being deployed.
In Spring of 2020, POP released a condensed Monthly Orchard Task List, which lists various orchard tasks for the majority of plants POP typically plants with partners throughout the season, giving a distilled yet detailed full season overview of possible tasks involved in maintenance of POP’s typically planted urban orchard or food forest plants compared to this information living in separate documents, blogs for various niche maintenance recommendations. When asked about the Monthly Orchard Task List or ‘Care Calendar’, 58% of partner respondents had seen this and found this useful, 33% had not seen this but are interested, one person did not find it useful, and two people were not interested. 46% of partner respondents would like or still need a copy of this care calendar. This resource has seemed to land well with those that saw it, and may prove to be a helpful tool in envisioning a full season of orchard maintenance while possibly assisting in partners making future plant choices with maintenance and capacity in mind.
POP also created a Community Organizing Toolkit in 2021, which 70% of respondents did not see yet but are interested in. 19% saw it and found it useful, while 1 person did not find it useful and 3 people were uninterested. 27% of partner respondents expressed interest in obtaining a copy of this. The Toolkit may be helpful in thinking about ways to structure community and volunteer involvement, but may not be a match for each space as they are all different, some orchards working with a very specific group or being located at a hospital or a preschool, for example, and needing just a few pre-approved regular adult volunteers.
POP has a longstanding Weed ID guide, published in 2014. 39% of partners would like a copy of this, and we are making an effort to deliver hard copies during quarterly visits this season. This weed ID guide is by no means exhaustive, and there are many more weeds to possibly highlight and assist partners in proper identification of, especially for partners with pollinator gardens and food forest plantings, which often contain various unhighlighted weeds that get confusing to a novice gardener new to many perennials that are included in these plantings. Deployment of plant ID signs will also help in minimizing weeding errors.
POP produced Rainbow Nutrition Cards in English and Spanish in 2019 that highlight a wide variety of common and lesser known fruits with harvest information, nutritional information, and recipes. We failed to inquire about the value orchard partners assign to these cards in 2020, but we did start delivering this resource during quarterly visits last year. 27% of partner respondents would like or still need a physical copy.
POP has grown its staff, interns, dedicated volunteers, and confident partners each year, while learning from each season. Despite the common misconception that orchards and perennial agro-ecosystems take care of themselves, the amount of time, knowledge, vigilance, practice and well timed labor needed to care for the orchard plants and ecosystems POP and POP partners work with (and to realize significant yields) is vast, especially with common Eurasian tree crops and common smaller fruits. As such, one thing we have learned is that much of the work POP pursues should be done through attempting to enter into and maintain relationships with full disclosure and understanding of what it takes to manage an orchard, picking plants that suit our partners’ capacities, setting our partners on sustainable and realistic paths with an abundantly-clear, realistic expectation and understanding of what POP brings to the table, and to shorten the span of time it takes to get up to speed through digestible hands on experiences and informational resources.
Organizational Improvement
POP exists first and foremost to support our Philadelphia orchard partners. Our model and current resources allow us to design and facilitate plantings of orchards and food forests, to do our best to visit each orchard quarterly with a maintenance day as partner participation and everyone’s availability dictates, and to respond to partner inquiries additionally on an as needed basis, most often remotely while seeking to empower our partners through educational offerings and possibly with additional POP enabled volunteer support.
While there are some identified areas where additional support is needed or desired, which includes more niche knowledge, personal capacity and people power, POP partners rate our services as outstanding. On a scale from 1 to 10, respondents’ average rating of POP as an overall organization was a 9.7 (9.4 in 2019, 9.2 in 2018). Partners that are responding have mentioned in the past that POP staff are supportive, adaptable, and easy to reach, though there are always ways that we can improve and often more support is desired. When asked how we can better support our partners in 2021, 63% of respondents wouldn’t change anything, 26% mention desiring more POP time, 3 partners reiterate desiring more pest and disease management guidance, and 2 mention specific tools. Prior suggestions include these same suggestions as well as more training, plants, signage, hard copies of resources, community organizing facilitation, fertilizer, and new staff orientation.
The 2020 POP Partner Survey was conducted and analyzed by Orchard Director Michael Muehlbauer, with report abbreviated for the blog by Co-Executive Director Phil Forsyth.
SUPPORT US! If you found this entry useful, informative, or inspiring, please consider a donation of any size to help POP in planting and supporting community orchards in Philadelphia: phillyorchards.org/donate.